UP Cebu is known for being a research university. This means that the university gives importance to the quality of the research produced especially on how these are completed. Therefore, we invest on software and applications which help student and faculty researchers in producing excellent and useful research. Acquiring a software which helps ease the process also encourage the researchers to be more productive.
One of the most challenging parts in doing a research study is data gathering and processing. You need to know how you are going to use the data that you need for your problem and interpret them based on statistical test results. To help you with that, the UP System has acquired Qualtrics, a web-based software that allows its users to create surveys and generate reports for your research without needing to have a programming experience. Just last December 13 and 15, 2021, the system together with the developers of Qualtrics, Thinkblink, Inc., conducted a two-day hands-on training of the software for UP Cebu and UP Baguio (training is done by batches per CU) representatives.
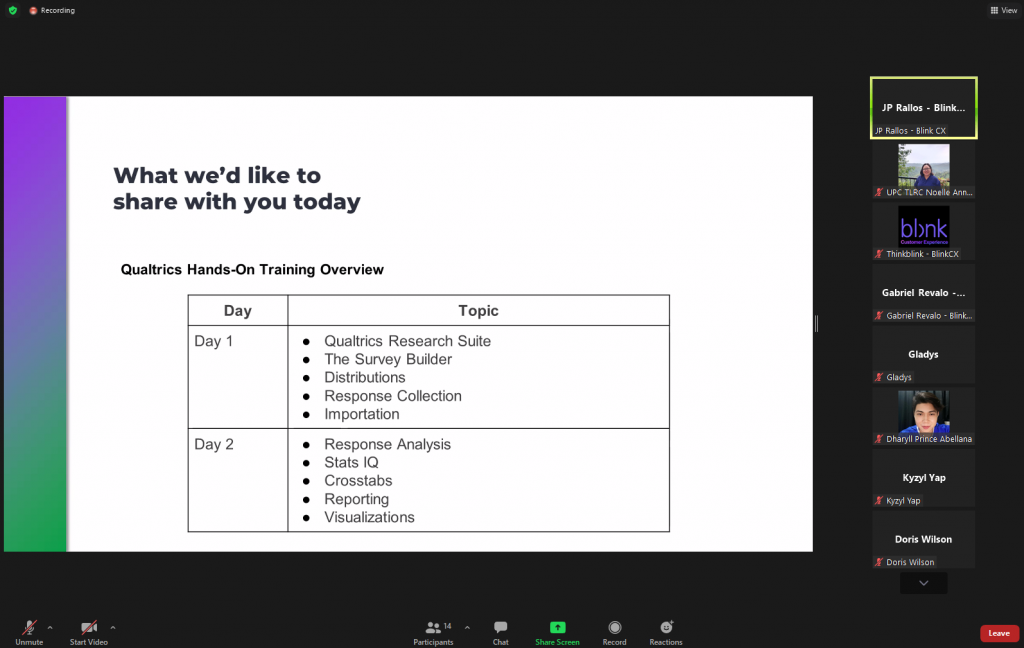
The training consisted of a step-by-step introduction to the basic functions of Qualtrics. From making and laying out an online survey up until generating statistical reports, the trainers were patient enough to explain the processes to us and to clarify those that we found confusing.
So, what makes Qualtrics special?
It is special because it is simple.
Although Qualtrics might not be perfect. What makes it different from its competitors is the simplicity of its interface and how all the reports needed can be given in just one run. It is a one stop shop if you prefer to have your data gathered and processed in one tool. The statistical tests available in Qualtrics include Correlation, T-test, ANOVA, and Chi square, among others. Upon generating your reports, Qualtrics is also able to give suggestions on what further tests you can do with the data you have. You must know your variables.
For the survey, it is somehow like google forms – but better. Aside from being able to edit each question according to the type of answer you need, you can also import questions and store these questions in case you want to reuse them. You can also control what question appears on a page and the manner of when the question appears, in terms of order, on the respondent’s screen. You can also group respondents to send your survey via emails and reuse these contacts again if needed.
These are just the highlights of a very comprehensive training course we had with Thinkblink. There is more to explore that will truly excite the researcher in you.