DATA ANALYSIS TOOLPAK IN EXCEL
The Analysis ToolPak is an Excel add-in program that provides data analysis tools for financial, statistical, and engineering data analysis.
How to load the Analysis ToolPak add-in: A Step-by-Step Tutorial
To load the Analysis ToolPak add-in in Excel, execute the following steps:
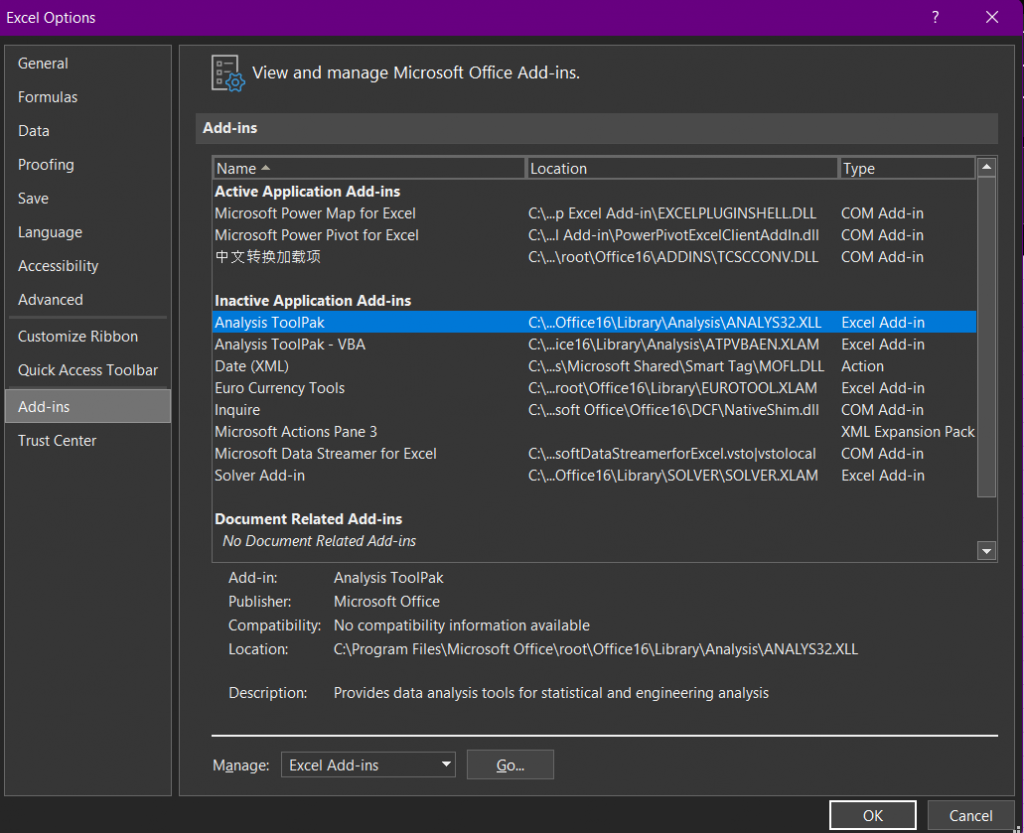
- On the File tab, click Options.
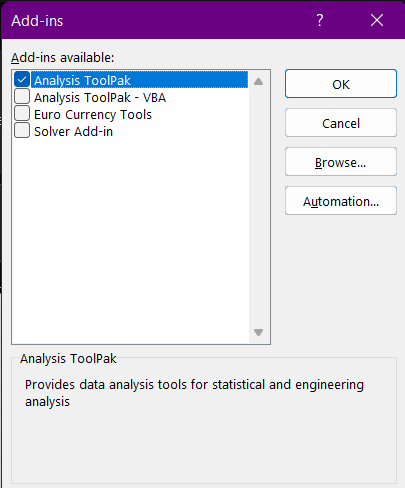
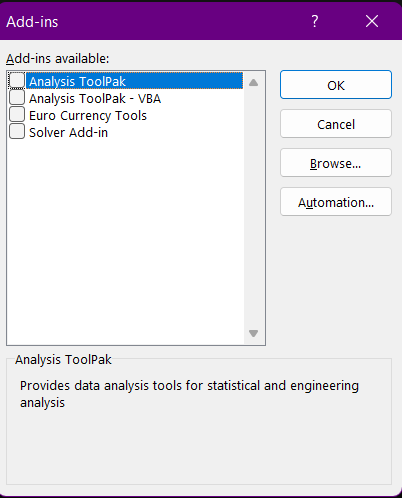
- Under Add-ins, select Analysis ToolPak and click the Go button.

3. Click Analysis ToolPak and click on OK.
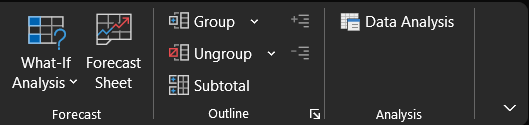
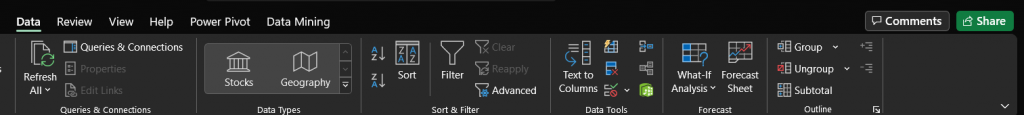
4. On the Data Tab, you can now click on Data Analysis in the Analysis group.
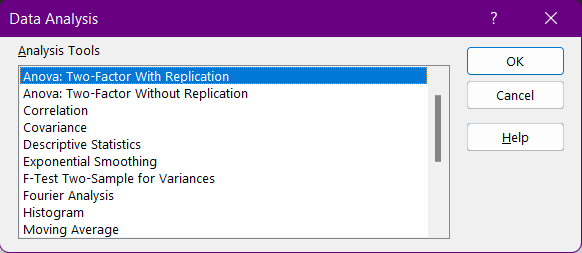
5. The following dialog box below appears. For example, select Anova: Two-Factor With Replication and click OK to create an Anova: Two-Factor With Replication in Excel.
Note: This process goes for non-iOS softwares.
How to disable Data Toolpak Analysis in Excel: A Step-by-Step Tutorial
To disable the Data Analysis Toolpak Analysis in Excel, execute the following steps:
- On the File tab, click Options.
- Under Add-ins, select Analysis ToolPak and click the Go button.
3. Uncheck the Analysis ToolPak box.
4. Click OK and the Data Analysis ToolPak will disappear from the Data Tab.
Note: This process goes for non-iOS softwares.

Minitab is a software product that helps you to analyze the data. This is a good alternative to Microsoft Excel. This is designed essentially for the Six Sigma professionals. It provides a simple, effective way to input the statistical data, manipulate that data, identify trends and patterns, and then extrapolate answers to the current issues. This is the most widely used software for businesses of all sizes – small, medium, and large. Minitab provides a quick, effective solution for the level of analysis required in most Six Sigma projects.
Click here for more information on how to manipulate the Minitab.
Next page is Pivot Tables in MS Excel.